What does it look like?
Following our blog about Thermographic Surveying earlier this year I have been asked to show just what a Thermal Image of an electrical circuit looks like. The easiest way to demonstrate the ‘hot spot testing’ is to show the image of an actual implement.
Please see below a copy of a recent Thermography Inspection carried out at one of our clients in Norwich. As well as looking at the distribution system our surveys can also cover current using equipment as shown below which are just as important to your business.
A photograph of the appliance is taken to identify the actual item tested and this is then followed by the Thermogram with the adjacent colour indications are monitored as shown in the diagram.
Photo and Identification
 | Water Pump Located in the boiler plant room |
Thermogram
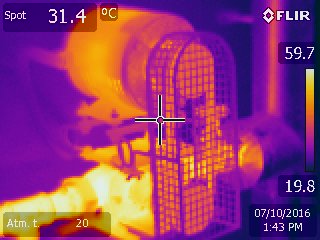 | Date: 10/07/2016 Time: 13:43:56 Image file: IR_2351.jpg Max. Temperature: 59.8 °C Ambient Temperature: 19.9 °C Camera Type: FLIR E40 Serial Number: 49032130 |
Analysis & Recommended Action:
At the time of inspection there where no areas of concern
By reviewing thermal images of equipment, decisions to either repair or replace equipment become more effective by increasing equipment reliability and overall costs reduction. By detecting anomalies often invisible to the naked eye, thermal imaging has evolved into one of the most cost effective and valuable diagnostic tools for both predictive and preventive maintenance.
Speed of operation coupled with the fact that thermal imagers do not require contact with the circuits or electrical components, has the advantage that they can be used when the system is under load thus giving a true picture of the working load and therefore under load.
If it is impractical for your business to shut down the electrical supply to carry out fixed wire testing then this non-disruptive, electrical testing service is for you!